


Methods:
Study Site:
Fannin County
lies on the Georgia-Tennessee line. The
largest water body is Blue Ridge Lake created in the 1930's now operated by the
Tennessee Valley Authority. Out of
391.43 square miles only 5.69 square miles are water bodies. Although Fannin County is not large in size
nor high in population, it has 10.24 percent out of the 5,437 miles of designated trout streams
within the 25 county trout stream region.
More than 63 percent of the designated trout streams are under private
ownership. ( DeMeo,T.A, Christy, D.R &
Kundell, J.E. 2005).
The northwestern area of Fannin
County east of McCaysville has a large catch basin with year round permitted
trout fishing. This catch basin
(Fightingtown Creek) flows north into the Tennessee River basin and will be our
initial target area unless the data leads us to other viable regions in the
county.
Data Requirements/Sources:
·
Trout Streams in Fannin County, GA (site: wildtroutstreams.com has GIS data)
depicted below in green was used as base information and location. Specifically the corridor on northwest side which
has year-round trout fishing was the
targeted zone (corridor of Hwy 207, 127, 2, 210, 159, 212. Primarily the catch
basin of Fightingtown creek). See area
below:
· Most
of the general data was obtained through the USGS (U.S. Geological
Survey)website, linked through to state specific data, ours being the Georgia
Spatial Data Technology. http://csat.er.usgs.gov/statewide/downloads.html Unfortunately, on August 1, 2012 the links to
the state specific data was disabled due to lack of funding. There was additional data this GIS Analyst
expected to obtain namely the DOQQ series for Fannin County, Georgia and other data clarified before the final
product was to be turned in. This did not occur. Alternative forms of aerials
was obtained.
Most of the USGS data was converted
from Clark 1866 to NAD 1983, some was originally NAD 1927 which was also
converted to NAD 1983.
· The
final projection and project projection chosen was Albers Equal Conical Area, Datum: D North
American 1983. Most of the USGS data and the individual Georgia data from the
Georgia GIS Clearinghouse and geocommunity.com were also in North Americas
Albers Equal Conic.
· As
the data was evaluated it divided into two groups, those scaled very large
based on the US Atlas series and those based on an individual state scale. A list of the data is below:
GNIS
for State of Georgia, 1997, point of accuracy 40 meters.
Counties
of Georgia, from US Census/TIGER-, 1996
The project will use the Fannin County, GA
extent
as its basis for all clips & raster extraction, accuracy 40 meters
USGS, topo maps in digital raster,
from 1975, accuracy 40 meters
USGS-Georgia
Cities & Towns, from US Census/TIGER, 1995, accuracy 40 meters
USGS-Georgia
Elevation, DEM, at 250, 1987, 3x3=1 degree,
USGS-
Georgia Slope, 1987, scale 1:100,000
Georgia
Soil Survey, 1994, accuracy 1230 meters, scale 1:250,000
Conservation
lands, reference Georgia GAP Project, 1999, accurate as 1:12000, public owned
lands w/o natural areas not included, not inclusive of all historic sites.
Georgia-
Landuse 1 & Landuse2, Land use from 1972-1975, accuracy between 10-40
acres, scale 1:250,000
USGS,
Georgia State park & Historical Sites, updated 12/1998, accuracy to 40
meters.
USGS,
River Basin Management Planning, file 06020003, Tennessee River Basin, NAD 1983.
Trout
stream information from wildtroutsteams.com,
georigiaoutdoors.com, and georgiawildlife.com.
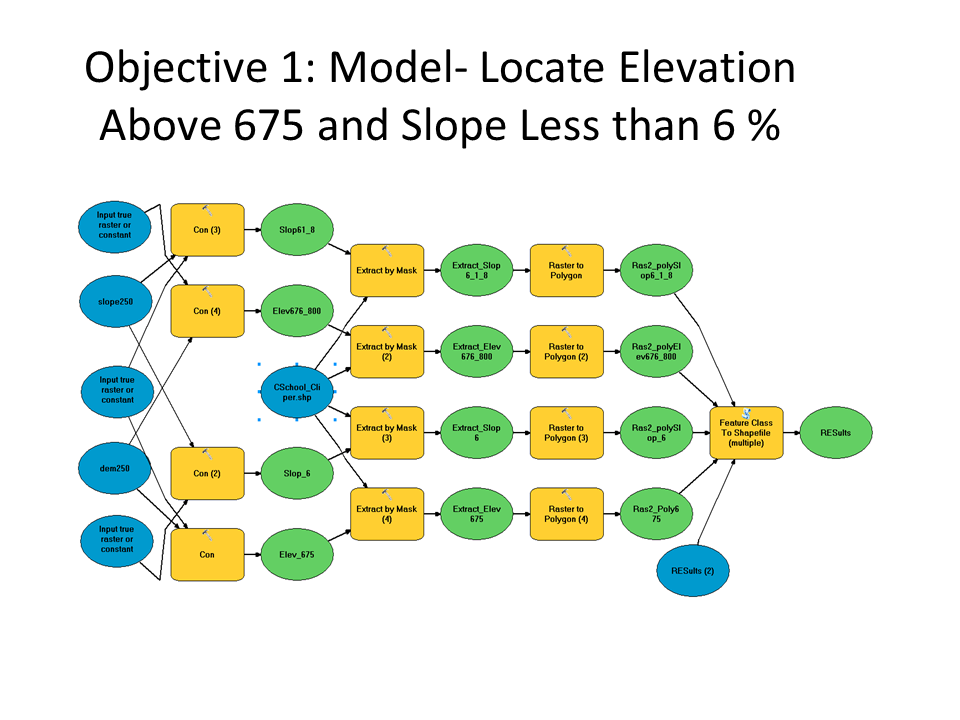
Analysis:
This project was accomplished
using GIS analysis based on specific criteria to locate potential Sites for the
community center. Specifically,
conditional raster analysis through the spatial analyst extension in ArcGIS Map
Version 10, was used. Conditional raster
analysis evaluates each raster cell
assigning it a true or false value based upon an established query.
In our case the DEM (elevation) layer was queried for Elevation 674 or
less and with a second value of 675 to 800.
With the Slope raster, it was divided into Slope less than 6 percent and
slope from 6.1 percent to 8 percent.
Alternatives were given at the time of evaluation to allow for
alternative sites if the original values did not produce results. The evaluation was conducted using a model
form. An issue arose when the original
selected clipping layer (Fannin Co) was a different scale from the originating
rasters in the conditional raster argument. After a new clipping layer was
found, the conditional raster model was rerun without difficulty.
Once the
Elevation and Slope rasters were converted to shapefiles the second evaluation
portion could be initiated. A Fannin
County base map was established using North America Albers Equal Conic as the
projected coordinate system for the model.
For each map, map properties
were established, environments were set using the original State of Georgia DEM
250 as the extent and coordinate system.
A State of Georgia base test map
was established to view data. Fannin Co,
isolated for the raster model was used to clip several layers: hydro, forest, GNIS, roads, etc. After the base layers of Fannin County were
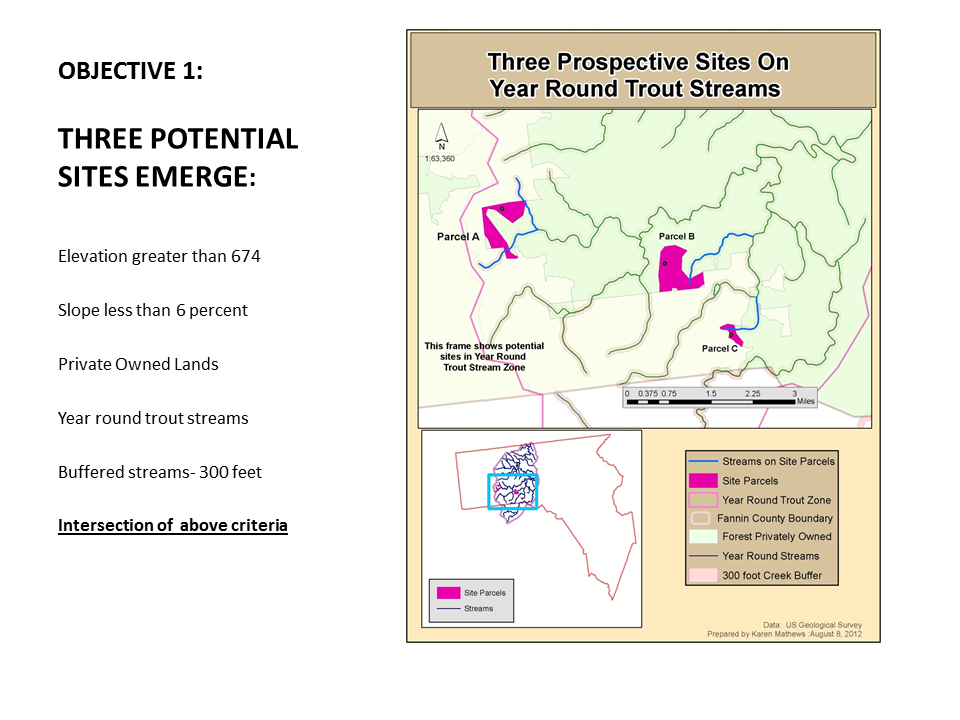
established, evaluation began. Elevation
and slope intersects were placed on the base map, then streams. As the results
began to appear county wide, potential areas for sites were coming into
view. These evaluations were created
and outputs made:
Elevation/Slope: (Results Map )
1-
Intersect between Elevation 675-800 with Slope under 6
2-
Intersect between Elevation 675-800 with Slope 6-8 (as an alternative was not
needed)
Year Round Streams: (Incorporated as
layer file in Maps):
3. New feature class for year round
streams was created, digitized using the paper Fannin County Trout Streams by
Georgia WildLife.com as a guide with the hydrology layer.
4.
Streams in Year round layer were buffered to 300 feet.
Private Lands: (Results Map)
5.
Forest layer added showing Federal and private lands, private lands isolated.
6.
Buffered year round streams and output of Elevation/Slope6 were intersected.
7.
Private lands intersected with output of Elevation/Slope6/Buffered.
Once criteria sites were identified, these visuals were printed out, then
using shape points, the GIS Analyst was able to locate common points using
georeferencing techniques. A common
point was either a static point on the boundary line of the federal lands or a
point on the streams. Geographic
coordinates were available on qpublic.net the official tax property parcel
website for Fannin County, Georgia. Using
a combination of matching points and Google aerial maps, sites were absolutely located to physical locations on the official Fannin
County property map. Although the site
parcel polygons did not match any
property parcels exactly, the GIS
analyst was able to coordinate the sites to common tax property parcels
containing portions of the desired site location. This was quite fortunate due to an unexpected
difficulty in obtaining orthiomagery for the site parcels. Funding cuts with USGS
occurred on August 1, 2012 which affected the retrieval of orthoimagery,
additional web sites where affected as well.
Notwithstanding the unexpected, Google Earth, enabled retrieval of
aerial images. For each of the sites,
A, B and C, a series of evaluations were made to satisfy Objectives Two and
Three.
The last
step in the analysis process was to apply a weighted analysis to several of the
criteria.
1. The
school, church, community layer was converted into a raster, then reclassed.
However, the reclassing did not result in the attributes being ranged from near
to far, but randomly spread out. This
does not work for our purposes. Since
there have been numerous issues with preparing this feature to raster etc. the
weighed analysis has not been successful.
2. The
roads layer was also converted into a raster, then reclassed. Checking the
attribute table the roads are classed from near to far, which works properly.
3.
Euclidean Distance was performed on each Site point, A, B & C. Each point
was reclassed as an individual raster.
4. A model
was set up for the weighted analysis.
For each run of the model the school and roads input remained the same. Each point was entered as a parameter and the
output was renamed accordingly. After review, the results were void, see
description of school layer above.
5. In light of the model issues, a weighted
chart was created. Several criteria in
Objective 2 & 3 had to be evaluated using visual analysis. A weighted chart was created for this. Same Chart as in conclusion Above.
Conclusion:
Using the
criteria set out by the client, three viable sites were found in the target
area using GIS Analysis over and above the usual search conducted by real
estate agents. Each possible site was
located on the ground using georeferencing techniques through the use of Google
Earth and the Fannin County Tax Assessor's web portal, qpublic.net.
A weighted
analysis was used through visual inspection of the properties centering on
Objectives two and three which required special application of the criteria. Applying the weighted analysis revealed
potential issues with the sites before actual trips to the physical locations
were planned, saving both time and money.
No comments:
Post a Comment